Description
In The age of data – driven decision-making, the ability to analyze, interpret and visualize data has become an essential skill across disciplines. Whether in Academia, Business, healthcare, or engineering, data analysis enables us to uncover patterns, test hypotheses, and drive actionable insights. this book is designed to guide readers through the statistical data analysis and implementation of charts using python programming for visualization.
Table of Contents
Preface
1- Introduction to Data Analytics
2- Working With Pandas
3-Exploring Data frames
4-Data Cleaning and Preprocessing
5- Data Visualization Using Matplotlib
6- Data Visualization Using Seaborn
7- Introduction to Plotly
8- Probability Distributions
9- parametric Tests
10- Non-Parametric Tests
11- Anova and Regression
Author
Jeeva Jose
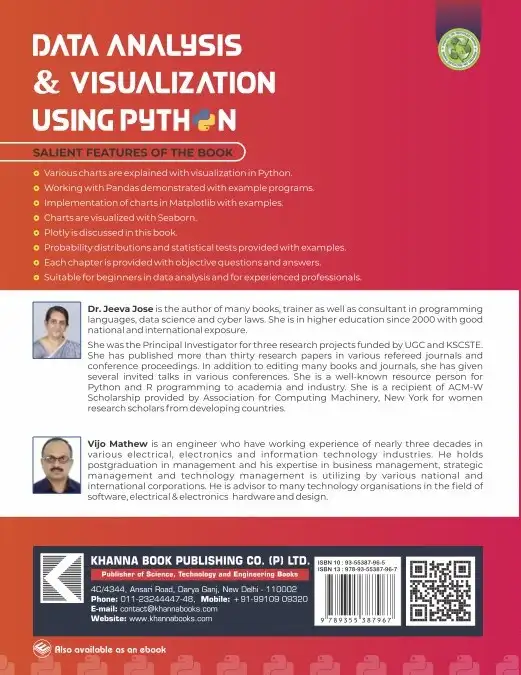
Dr. Jeeva Jose completed Ph. D. in Computer Science from Mahatma Gandhi University, Kerala, India and is a faculty member at BPC College, Kerala. Her passion is teaching and areas of interests include world wide web, Data Mining and Cyber laws. She has been in higher education for the last 15 years and has completed three research projects funded by UGC and KSCSTE. She has published more than twenty research papers in various refereed journals and conference proceedings. She has edited three books and has given many invited talks in various conferences. She is a recipient of ACM-W Scholarship provided by Association for Computing Machinery, New York.
Vijo Mathew
Vijo Mathew is an engineer who have working experience of nearly three decades in various electrical, electronics and information technology industries. He holds postgraduation in management and his expertise in business management, strategic management and technology management is utilizing by various national and international corporations. He is advisor to many technology organizations in the field of software, electrical & electronics hardware and design.


Reviews
There are no reviews yet.